Insider trades and analyst recommendations - The difference between analyst outlooks on certain stocks and the related insider trades sometimes diverge (very significantly), which makes one definitely question which of the two offers more informative substance.
There is surly some evidence of a negative relationship between insider trading and analyst coverage. And the first impression is reinforced that insider trading has a greater signaling effect. Which is eventually plausible when you think about “who has skin in the game?”
1 Getting all the data
With web scraping, 16.658 individual stock analyses have been deducted so far, mapping the view of 791 individual stocks to the near future. In Insider Trading, there are 21.300 individual trades collected with 2017 individual stocks.
We obtain the insider deals via web scraping through the financial site finviz. An extremely good informative source of financial market oriented information. For scraping we use the r package {polite}, which first requests authorization of the site and after successful confirmation, scrapes the site. The polite way on the Internet:
finviz <- "https://finviz.com"

session_finviz <- polite::bow(finviz, force = FALSE,verbose = TRUE)

all_insiders <- suppressWarnings(
  polite::nod(session_finviz,
              stringr::str_c(finviz, "/insidertrading.ashx")) %>%
    polite::scrape(verbose = TRUE) %>%
    rvest::html_node(".content") %>%
    rvest::html_table()  %>%
    .[-1,] %>%
    janitor::row_to_names(1) %>%
    janitor::clean_names()
)
Equivalently, the analysts’ recommendations are also received via finviz. For this purpose, the individual stock pages are accessed and the respective analyst evaluations are read out.
1.1 Slice & Dice
In order to make all the analyses of the Insider Trades and Analysts Recommendations visible and at all comparable, we group and cluster the individual stocks in the following via the main indices Nasdaq100, S&P500, Eurostoxx50, DAX40 und ASX200.
In addition, due to the current situation of financial turmoil caused by the Ukraine war, supply chain bottleneck, record inflation and energy crisis, it is interesting to see how analyst expectations develop over the period YTD 2021 and how insider trades unfold. This also includes how the media focus on individual companies behaves when they execute increased transactions or issue profit warnings/increases.
2 Analyst Recommendations within Main Indices
2.1 Grouping by Indices
Fianancial market analysts are assumed to be experts in the stocks they cover and their opinions are sound, meaningful and trustworthy. Consequently, a constant attention is paid to the analysts’ ratings.
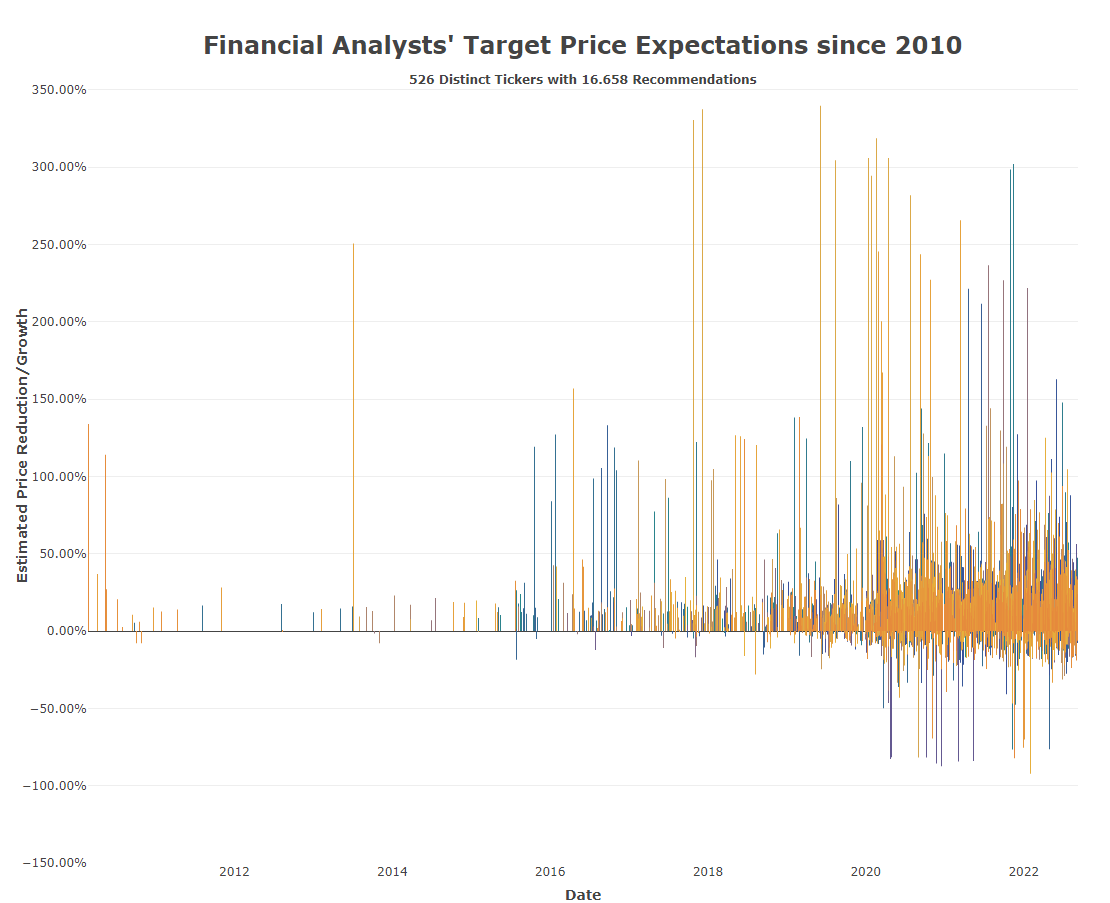
To give us a better overview of the analysts’ recommendations, the 16,658 individual analyses on 791 individual stocks are reduced by filtering out 4160 individual analyses in the period 2022-01 to 2022-09. Since the web scraping is primarily via US website, European stocks are also represented rather less frequently. In the following chart, all indices are still included, but we will take a further granular look at the NASDAQ 100 later on.
Since the respective recommendations provide a target price value, we relate this target value to the respective end-of-day value (EoD price) and thus determine the potential that the analysts see for the period up to 12 months ahead for the given recommendation.
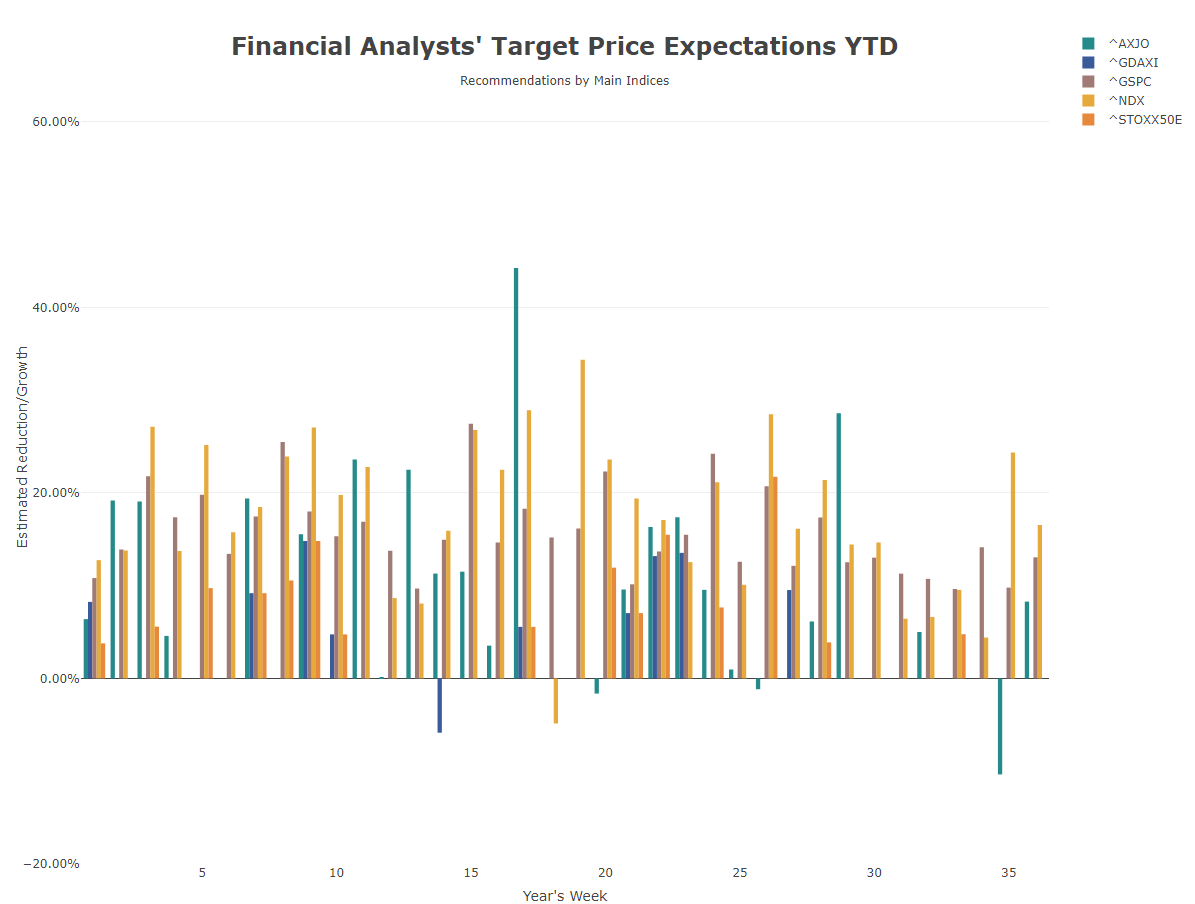
Expectations YTD in Main Indices (seperated)
It is striking that, with a few exceptions, analysts’ expectations are overwhelmingly positive. However, this has a rather convincing explanation. According to a WSJ article, analysts’ annual bonuses depend on how well and frequently they are in contact with company executives, and thus how well they access the companies’ overall information determines their own salaries. Not wanting to jeopardize these lucrative relationships with the companies’ executives might explain why analysts usually rate stocks as “buy” or “hold.”
It becomes particularly clear in the chart of the rolling average. For the rolling average, we use an auxiliary function that gives us the moving average of the last 20 business days:
# Rolling mean
rolling_mean <- timetk::slidify(mean, .period = 20, .align = "right")

analyst_indices %>%
  dplyr::arrange(date) %>%
  dplyr::group_by(date) %>%
  dplyr::mutate(day_mean = mean(new_potential, trim = 0.0)) %>%
  dplyr::ungroup() %>%
  dplyr::distinct(date, day_mean, .keep_all = T) %>%
  dplyr::mutate(roll_mean_20 = rolling_mean(day_mean)) %>%
  dplyr::filter(date >= "2022-01-01") %>%
  plotly::plot_ly(x = ~date, y = ~day_mean,
                  type = 'bar',
                  colors = palette_main[3],
                  color = "Day Mean",
                  hovertext = ~paste0("day: ", date, "<br>",
                                      "day mean: ", scales::percent(day_mean, accuracy = 0.01)),
                  hovertemplate = "%{hovertext}<extra></extra>") %>%
  plotly::add_trace(x = ~date,
                  y = ~roll_mean_20,
                  type = 'scatter',
                  mode = 'lines',
                  line = list(color = main_color, width = 3), name = 'Rolling 1 Mth Average') %>%
  plotly::layout(annotations = list(
    list(x = 0.5 , y = 1.00, text = "<b>Financial Analysts' Target Price Expectations YTD</b>", showarrow = F, xref='paper', yref='paper',
         font = list(size = 24)),
    list(x = 0.5 , y = 0.95, text = "<b>All Tickers in SPX/NDX/SX5E/DAX40/ASX</b>", showarrow = F, xref='paper', yref='paper')),
    xaxis = list(title = "<b>Date</b>"),
    yaxis = list(title = "<b>Estimated Price Reduction/Growth</b>",
                 tickformat = ".2%",
                 tickvals=seq(-2,2,.2),
                 range = c(-0.3, 1)))
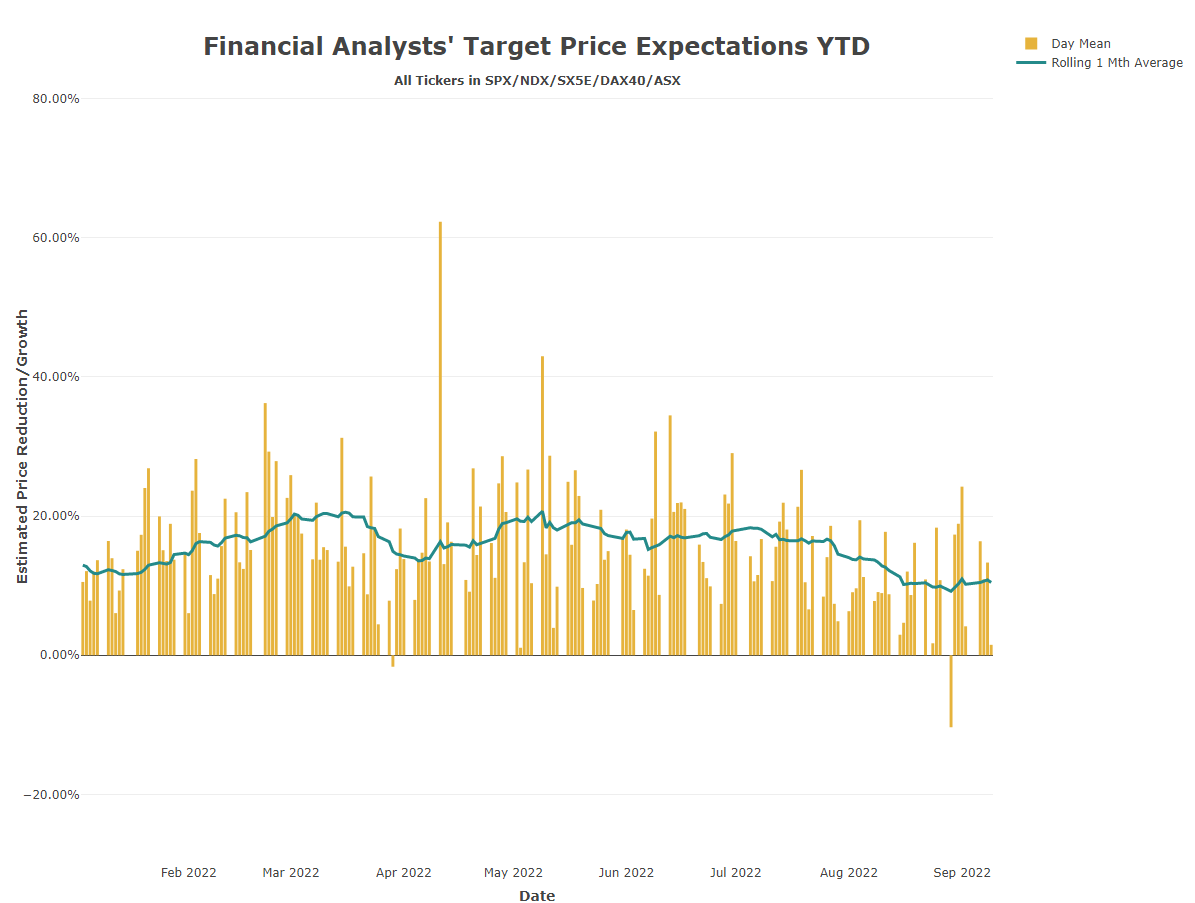
Rolling Expectations YTD in Main Indices (combined)
The rolling average shows that the mean ranges constantly between 15% and 20% of the expected price potential. Considering an average annual return of 8.5% of the MSCI World over the last 5 years, analysts’ expectations are significantly higher across the board. And this at times of quite a few global disruptions!
2.1.1 Reasoning
In addition to the above explanation, for instance, a former Wall Street analyst states that stock analysts are wrong more often than they are right, i.e., they are right less than 50% of the time with their recommendations over the long term. Also, to hedge their position, analysts sometimes join forces on price targets and recommendations, i.e. Sell, Neutral or Buy. So if an analyst is wrong with his decision, he can say that the entire stock market was also off. This does not mean that these analysts have no use in the financial system. They are a good source of information, investor sentiment, management perspectives, product trends, insightful research, surveys, etc. Furthermore, professional investors rarely cared about exact price targets, but were much more interested in the overall thesis of the stock and the detailed assumptions about the business model.
So, in order to benefit from the given information from stock analysts, one needs to go beyond the highlights and see if the thesis makes sense, and follow the analyst for some time to ensure credibility.
3 Insider Trading within Main Indices
3.1 Grouping by Indices
An alternative approach might be to pay attention to what financial experts do, rather than what they say. Therefore, we are monitoring the filing of Form 4, wherein insider dealings of companies are disclosed. In this, the US Securities and Exchange Commission (SEC) defines an insider as any officer, director or owner of more than 10% of a publicly traded company. Insiders must file Form 4 with the SEC within two business days of trading in their company’s stock.
Information on insider activity can be obtained free of charge from various financial websites. In order to remain congruent in our brief evaluation, we obtain the insider trades via the same source as our analyst advice via web scraping on finviz.
Our breakdown of insider trades over 6493 individual trades from YTD, shows that the main trades were also in the Nasdaq100 (1302) and S&P500 (5185) indices.
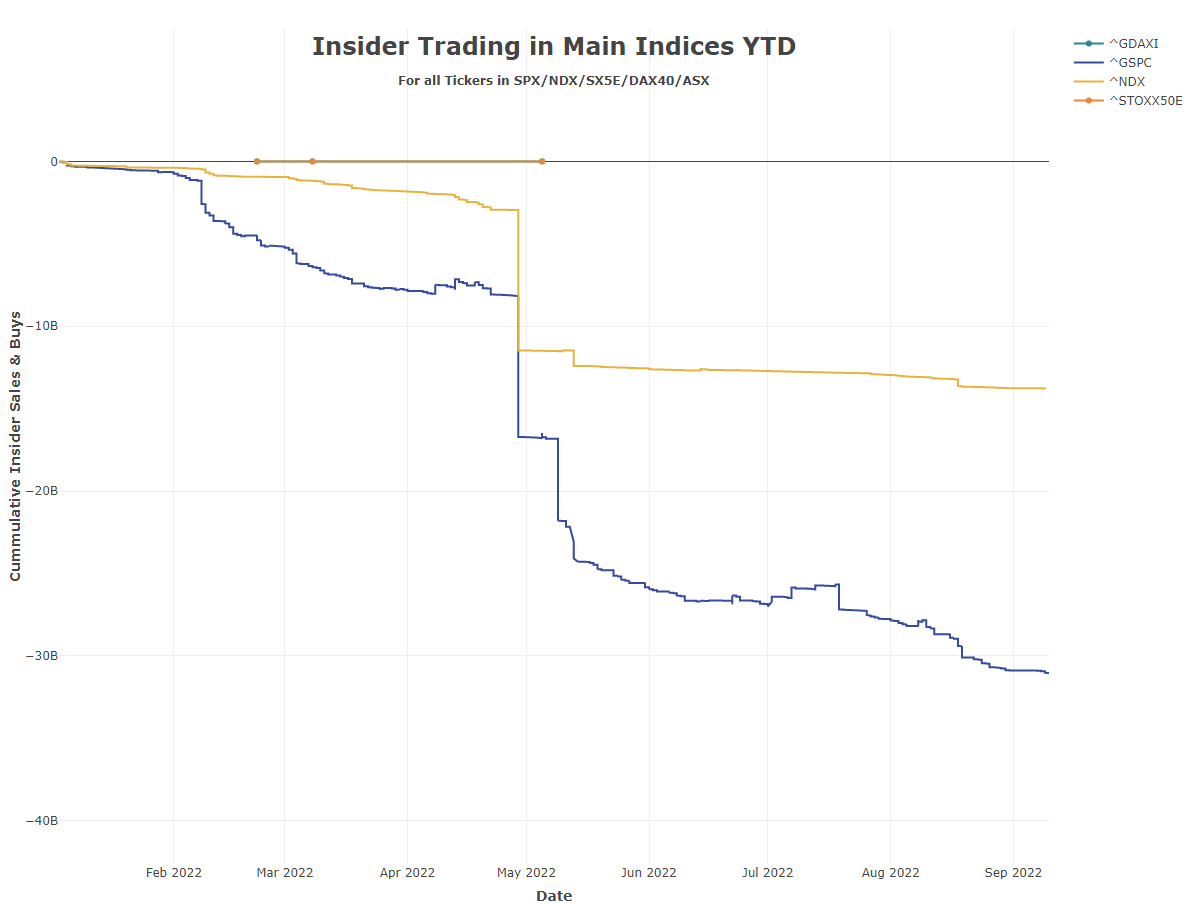
Insider Trading YTD in Main Indices
3.1.1 Reasoning
Reasons why executives, directors, and others with insider knowledge of a public company buy and sell stock can be very different. When company insiders start buying shares of the company, it may signal outside investors to do likewise, but it is important to notice which insiders are trading. One of the greatest investors, Peter Lynch, once said, “Insiders may sell their stock for many reasons, but they buy it for only one: they believe the price will go up.”
Of course, there is no guarantee that investing alongside an insider will be profitable. Company insiders are sometimes overly optimistic about their own companies. Often they are too early, and sometimes they are just plain wrong. Also, the most optimistic insider signals - where insiders “pile up” and buy their own shares - are very rare.
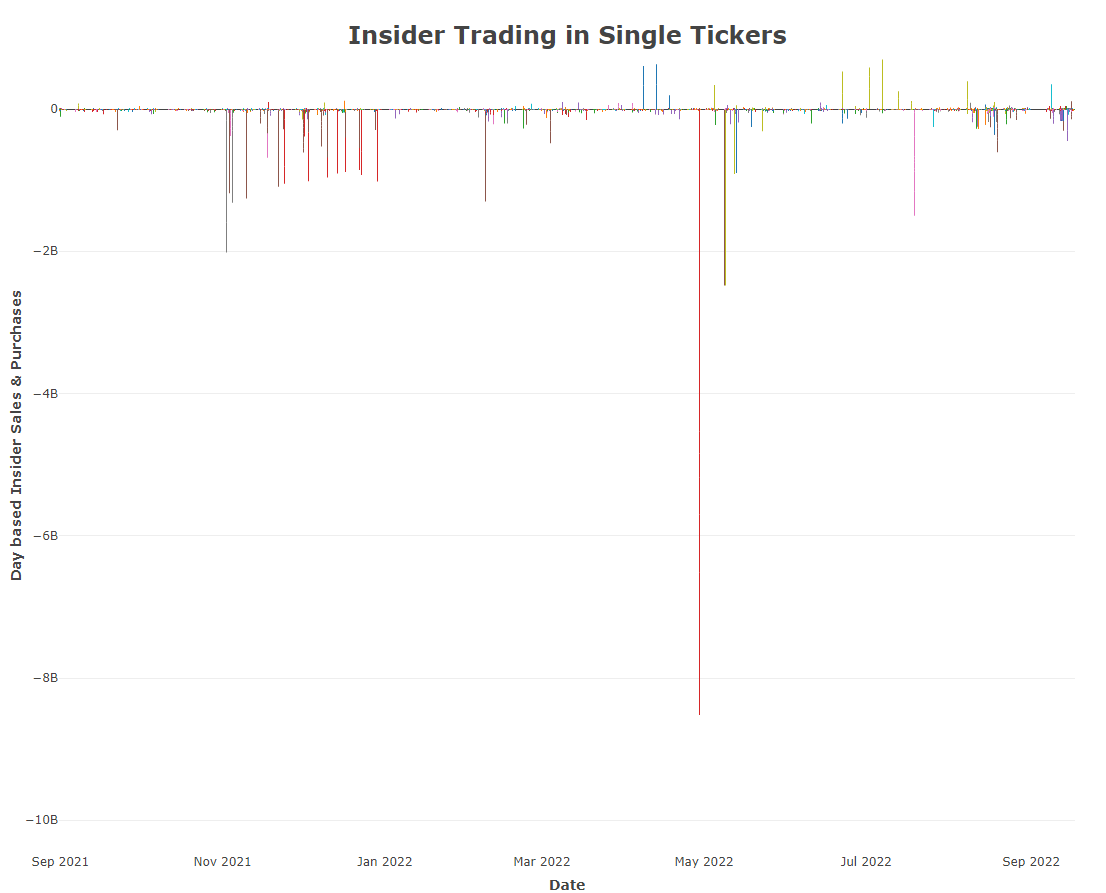
Even though insider buy their company’s stock because they expect good things to happen, insiders don’t sell simply because they believe their company’s stock will lose value. Insiders might sell for all sorts of reasons. Perhaps an insider’s sale is insignificant and represents only a small portion of that person’s wealth. Or follows a redemption plan to offset compensations of his salary. Or simply, as in this TESLA example of April 2022, that the CEO sells a very high stake in order to finance another company takeover.
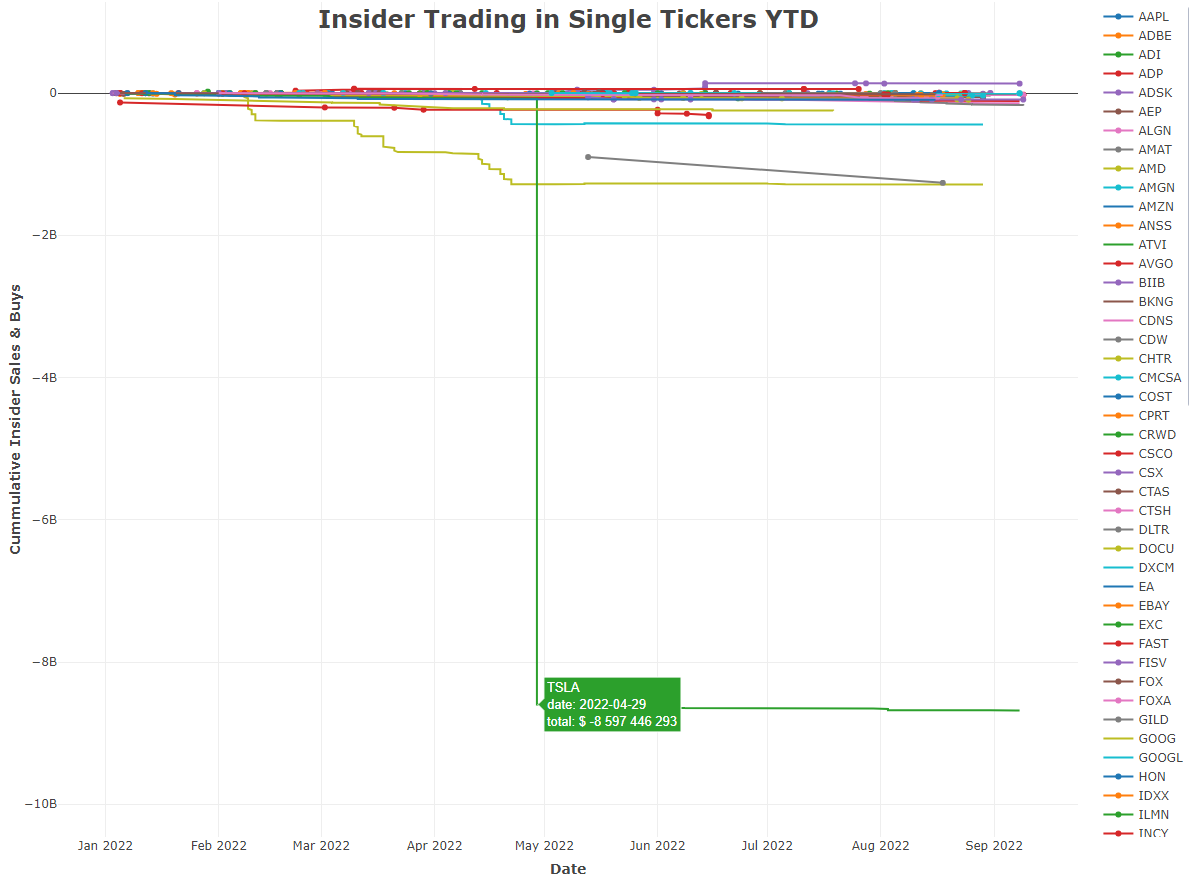
Insider Trading YTD in all Tickers
4 ‘Hit Ratio’ Comparison
To make the two approaches comparable in terms of investment performance, we also use the price trends of the shares over a predefined period in the case of insider trades to find out whether the insiders’ trades have paid off and how the investments have performed in accordance with the analysts’ advice.
In order to determine the more sustainable development of the companies’ value, which is assumed especially in the case of larger purchases by insiders, it would be more suitable to review this by using the company’s book ratio. There are already some studies on this using the Market Profile Theorem (MPT). In our approximation example, we are fine using the price development of the shares.
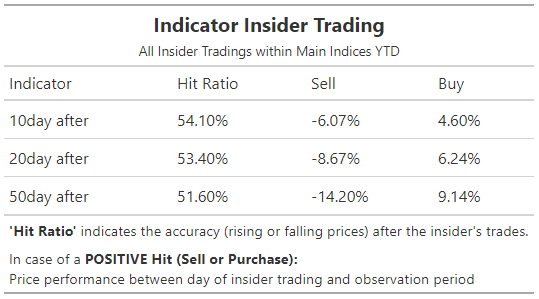
If you simply follow every insider trade, you will more often than average be on the right side of the forecasted trend and can expect to make a profit, assuming that the incorrect trades do not result in a much higher loss (which in our example, they aren’t).
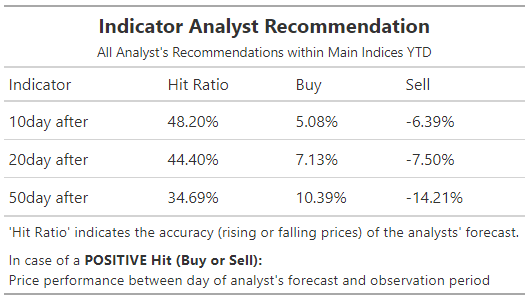
On the analysts’ recommendation side, on the other hand, one would above average often be on the wrong side of the forecasted side. The performance of the opposite trade in our example is more or less the same as the correctly estimated short-term performance, so that the analyst’s advice does not seem to add any direct value to the investment performance.
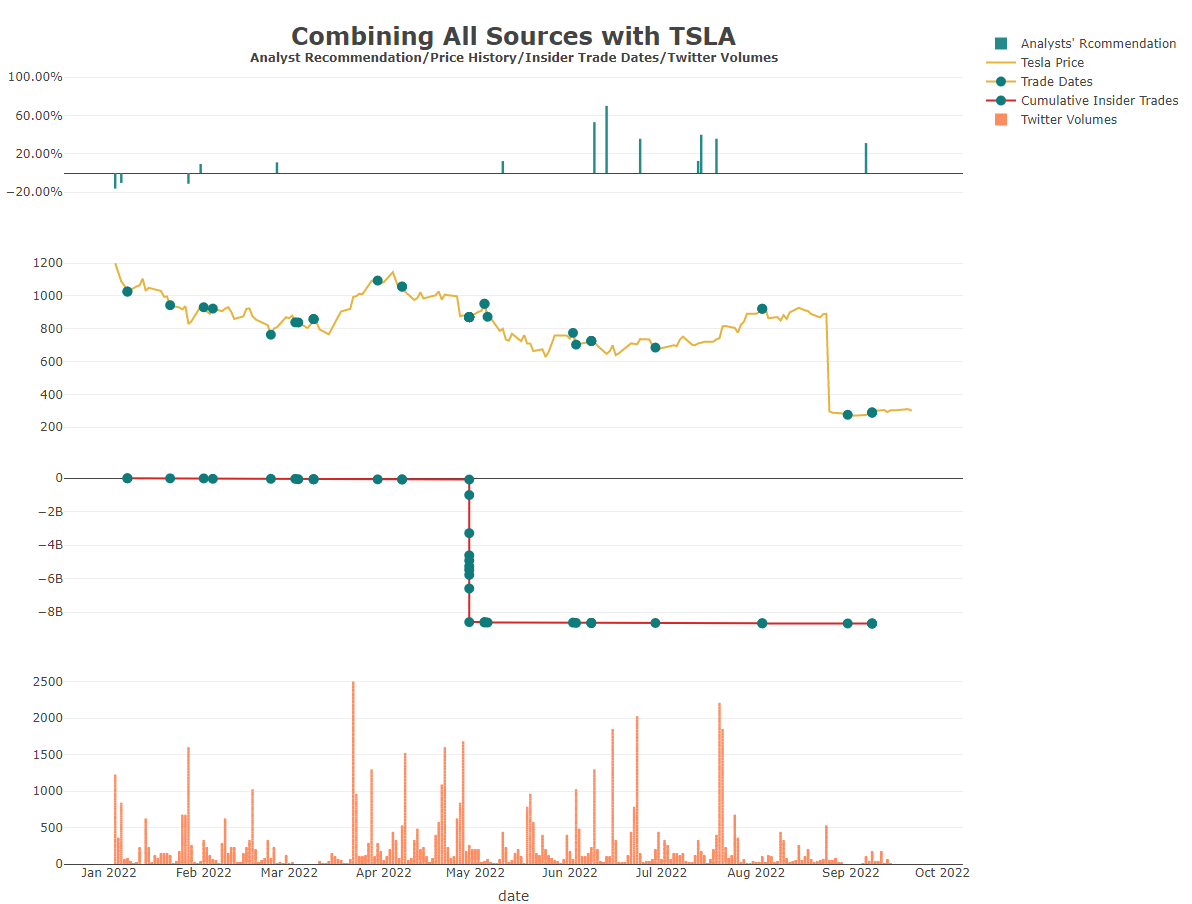
5 Insider Trading and Analyst Recommendation and News Heat with TESLA
Tesla CEO Elon Musk sold $8.5 billion worth of shares in the electric car maker in the three days in late April 2022 after Twitter’s board agreed to sell the company to Musk.
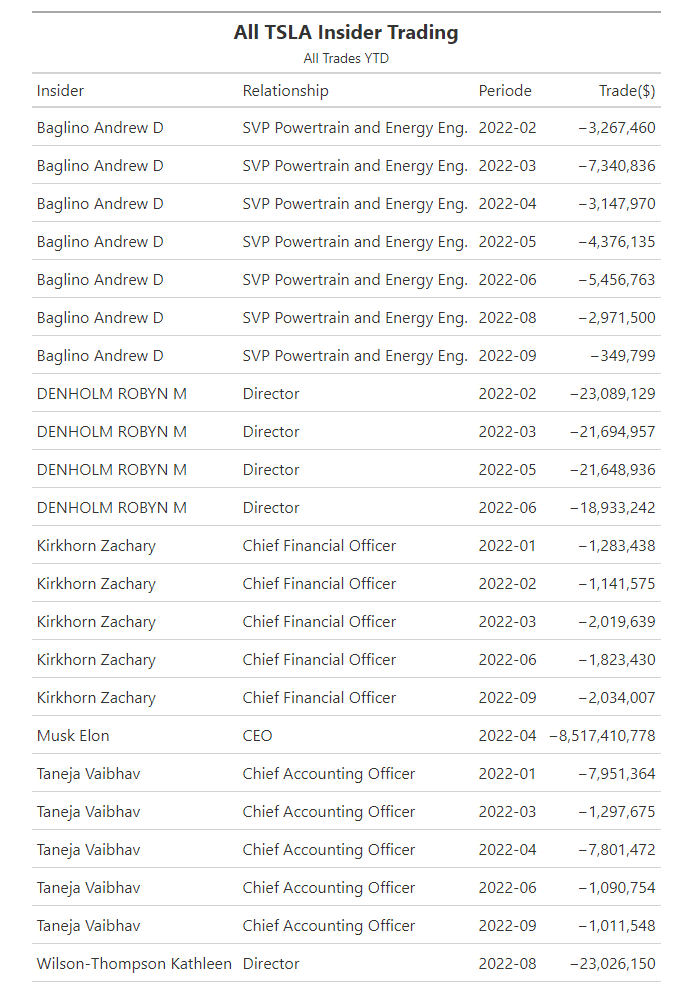
Insider’s Trades in TSLA YTD
Actually, one would expect that such a transaction should cause a larger reaction. However, the media coverage of the planned Twitter acquisition had already been covered and discussed so well in advance that the event itself became a “no event”. The subsequent price drop in the chart is based on the stock split, which was carried out 3-for-1 in August.
Insider Trading YTD in all Tickers
6 Main Considerations
When comparing the trustworthiness of insider trading and analyst recommendations, it is not necessarily a contest.
As we have seen before, the primary goal of stock analysts is not necessarily to predict a company’s performance correctly and on time, but rather whether the respective company models are still reasonable.
Insider trades, on the other hand, offer a more direct insight into the development of the respective company’s value, considering a few basic rules that can be followed when classifying insider trades:
Some insiders are better than others. Directors know less about a company’s prospects than executives. The most important executives are the CEO and CFO. Those who run the company know best where it is headed.
A lot of trading is better than a little. One or two insiders in a large company do not indicate a trend. Groups are a better sign that something is happening. In general, individual trades are unreliable.
People in small companies know more In small and mid-sized companies, virtually all insiders are aware of the company’s financial data. In large companies, information is more widely dispersed, and generally only the core management team has an overview of the big picture.
Stay the course. Evidence shows that insiders tend to act well ahead of expected news. They do this in part to avoid the appearance of illegal insider trading. Some studies show that insider activity precedes certain corporate news by up to two years before it is finally released.
As always, we are open to and appreciate suggestions, exchanges and recommendations either via LinkedIn or info@aikia.org! Hope to hear from you soon…