In the financial sector, Asset Managers and other Financial Services are facing various rapidly growing challenges. Currently, the main issues are the growing cost pressure and the significant increase in their scope of data processing.
Not only is the volume of data that Asset Managers have to cover increasing, but the growing complexity of the data also represents a major challenge for the companies. This further increases the procedural complexity of their tasks and means immense time pressure.
Not to lose focus, Asset Managers must be able to differentiate between relevant and irrelevant data for their specific needs. At best, they must be able to switch quickly between approaches and decide which data is better suited to their primary objectives without excessive procedural effort.
Consequently, the current trend in the search for AI-based use cases is intensifying, also with the potential to transform traditional practices. Here, natural language processing enables rapid analysis, which flows into decision-making.
In the following, we will discuss an approach that
* automatically streamline workflows,
* improve the understanding of data and
* help to quickly structure the flood of information.
We are expanding the use of large language model technologies to set up AI-supported numerical data analysis.
1 Our Use Case
In addition to the “standard” AI data analyses for determining sentiment and summarizing news, this approach deals with the evaluation of purely numerical day-to-day data sets, such as ratios, valuations and performance indicators.
The straightforward advantage is that not every analysis has to be explicitly coded and amended in a programming language. Once a set of text formats has been generated, the data sets can be simply re-queried as often as required across different key figures.
This results in an increase in efficiency, which enables a much higher level of information coverage and interpretation and contributes to more confident decision-making.
2 Data Encoding
First, the data must be converted into a format that the Large Language Model can understand. This usually involves encoding the data into a structured format. The numerical data, such as P/E ratios and YTD performance, are used in conjunction with their descriptive variables. This ensures the relationship between company, key figure and key date.
In our example, we load the symbols and companies of the S&P 500 market index. In order to be able to query a sufficiently large information set later on, we add further background information on the companies to the data set:
# retrieval of base information of all companies
tic_info <- DBI::dbGetQuery(con,"SELECT symbol,name,country,industry_group,industry_sector,issuer_industry,business_description
                            FROM symbol_data
                            Where `index` = 'S&P500'))") |>
  dplyr::as_tibble()

# combination of single information strings to form a complete text
for(i in 1:nrow(tic_info)){
  line_info[i] <- paste0(
    tic_info$name[i],
    " has the yahoo symbol ", tic_info$symbol[i], ". ",
    tic_info$name[i]," operates in the industry_sector ",tic_info$industry_sector[i], " within the industry_group ",tic_info$industry_group[i], ".",
    "The issuer_industry is ",tic_info$issuer_industry[i],". ",tic_info$name[i]," is based in country code ",tic_info$country[i],
    " and hast the following business description, ",tic_info$business_description[i])
}

ticker_info_results <- stringr::str_c(line_info, collapse = "\n\n")
This gives us a standardized structure for all companies in our scope that are available to us for later queries:
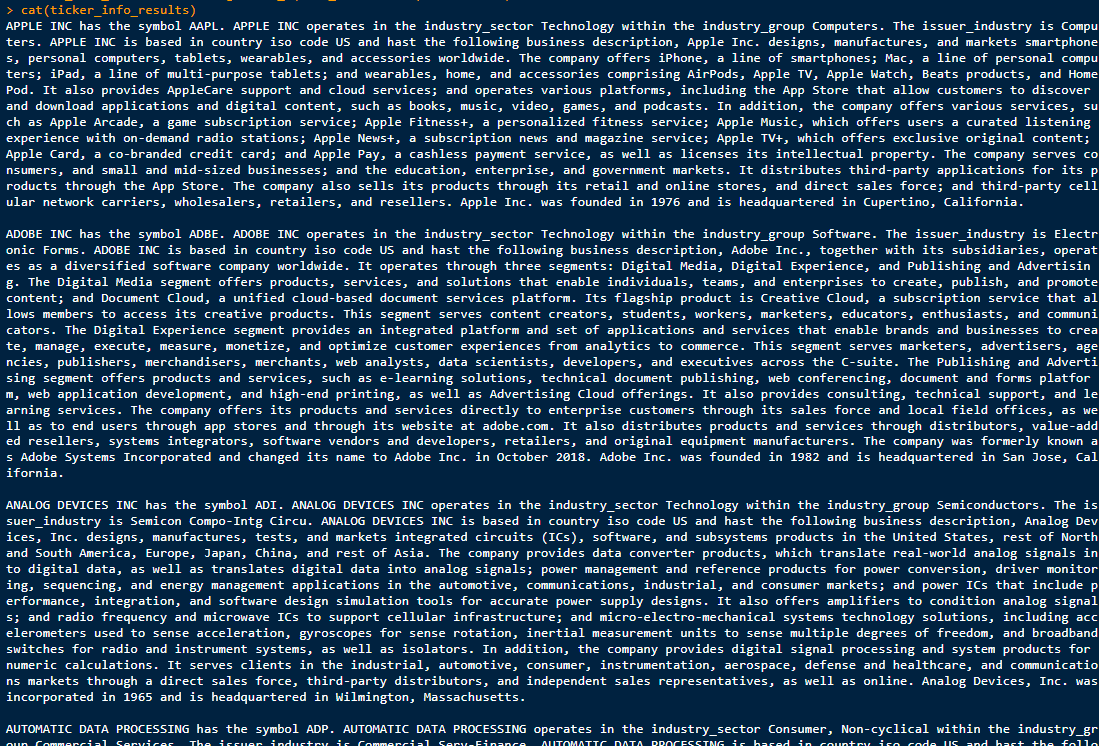
The primary goal of this approach is to generate a data set from the actual numerical metrics that we want to finally query. This can be any set of key figures. Preferably one whose data is regularly updated and used for various analyses and further tasks.
In our example, we assume that we want to obtain information on the companies in the S&P500 index regarding their valuations, growth and profits. We may want to find out which company has better key figures in relation to a competitor and can demonstrate a solid basis. To do so, we load an sufficiently large data set from the database.
# retrieval of key figures of all symbols to a specific date
tic_sensis <- DBI::dbGetQuery(con,"SELECT symbol, date,name, trailing_pe,forward_pe,peg_ratio,short_ratio,
quick_ratio,current_ratio,earnings_growth,ebitda_margins,
gross_margins,operating_margins,profit_margins,
revenue_growth,return_on_assets
FROM symbol_daily_market_data
WHERE `index` = 'S&P500'
and `date` = '2024-03-27'") |>
dplyr::as_tibble()
# combination of single key figure information to form a complete text
initial_date_linepaste <- paste0("At ",
tic_sensis$date[i],", for ",tic_sensis$name[i], " with symbol ", tic_sensis$symbol[i],", "
)
# Loop over each column
for (j in 1:ncol(tic_sensis)) {
# Construct the string for each column
row_strings[j] <- paste0(names(tic_sensis)[j], " has a value of ", round(tic_sensis[i, j],digits = 2))
}
# Combine the strings for the row into a single string
result <- paste(row_strings, collapse = ", ")
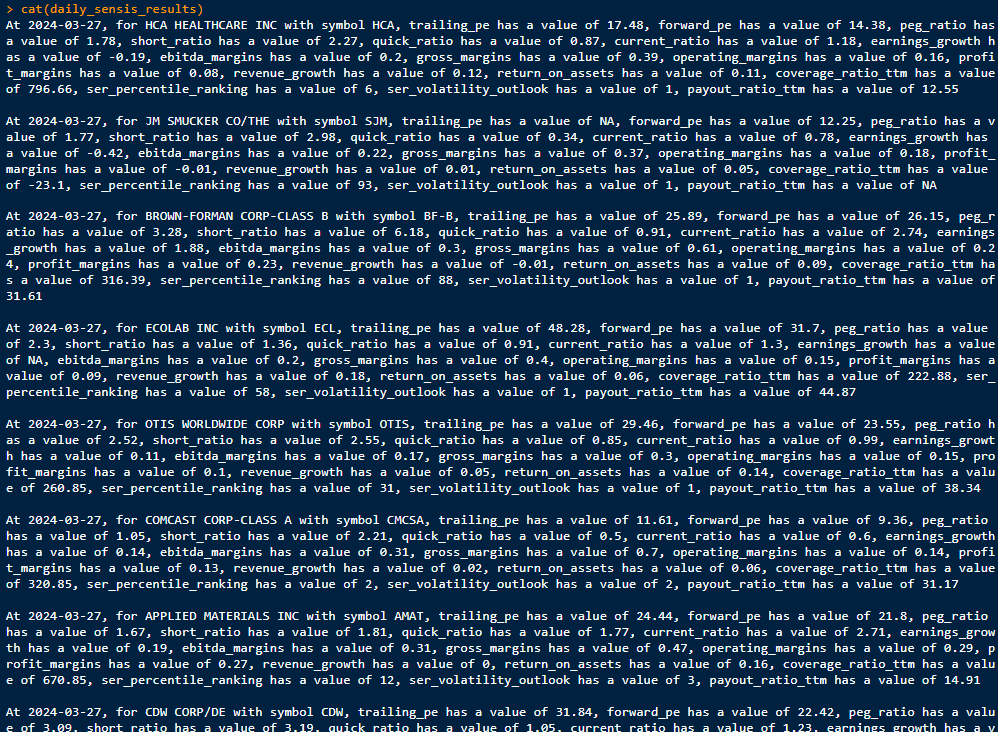
line_result <- paste0(initial_date_linepaste, result)
This gives us a complete picture of the daily key figures of the companies in the index. Coded into a continuous text, the LLM model can “understand” and process the key figures:
3 Input Formation and Setup of the Large Language Model
In order to pass our set of data to the OpenAI API to process it, we need to structure the data into an input format accordingly. Typically, this involves constructing smaller text blocks that allow the AI to find suitable context and return it to us as a source and answer. In this case, the prompt should contain details about the ratios and valuations and the company details for each stock.
As we run our script in R we simply use the reticulate package to switch language to python only for the setup of the LLM model.
py_all_info <- reticulate::r_to_py(all_info)we can now utilize the rule-based splitting technique of the langchain package to split the text into the chapters we intend to use and convert the result into a document format.
reticulate::py_run_string('from langchain.text_splitter import CharacterTextSplitter
splitted_txt = r.py_all_info.split("\\n\\n")
new_splitted_doc = CharacterTextSplitter().create_documents(texts = splitted_txt)')

py$new_splitted_doc
In order to find matching results to our questions, we need to setup vector database, where we save our single text strings. We can use Chroma’s local storage service to save the embeddings and save everything in a newly created folder.
In general, word embeddings are used to represent words as vectors in a low-dimensional space. These embeddings capture the meaning and relationships between words, allowing machine learning models to better understand and process natural language.
reticulate::py_run_string('import os
from langchain.embeddings.openai import OpenAIEmbeddings
from langchain.vectorstores import Chroma

# Place to store Eemdeddings
chroma_store_directory = "C:/gpt_chroma_db"
# Setup Vector Database
vectordb = Chroma.from_documents(
    documents=new_splitted_doc,
    embedding=embedding_obj,
    persist_directory=chroma_store_directory
)')
As a finally step in the setup, we need to establish a OpenAI Connection. In our use case we use chatgpt’s the LLM gpt-3.5-turbo model and link this to our vector database. The result is a Q&A concatenation that we can use for our questions.
reticulate::py_run_string('import openai
from langchain.chat_models import ChatOpenAI
# Assign chatgpt model
llm_model = ChatOpenAI(model_name="gpt-3.5-turbo", temperature=0)

# Using langchains RetrievalQA to create a chain
from langchain.chains import RetrievalQA
qa_chain = RetrievalQA.from_chain_type(llm_model,retriever=vectordb.as_retriever())
')
4 Q&A about the numerical set of data
The actual achievement of the approach can be seen here: By automatically importing the daily numerical data in the form of a continuous text, we can now simply ask our LLM model which value has developed and how, without having to write new source code in a programming language or recode it for each query! This approach saves time, costs and resources that can be reprioritized for other needs.
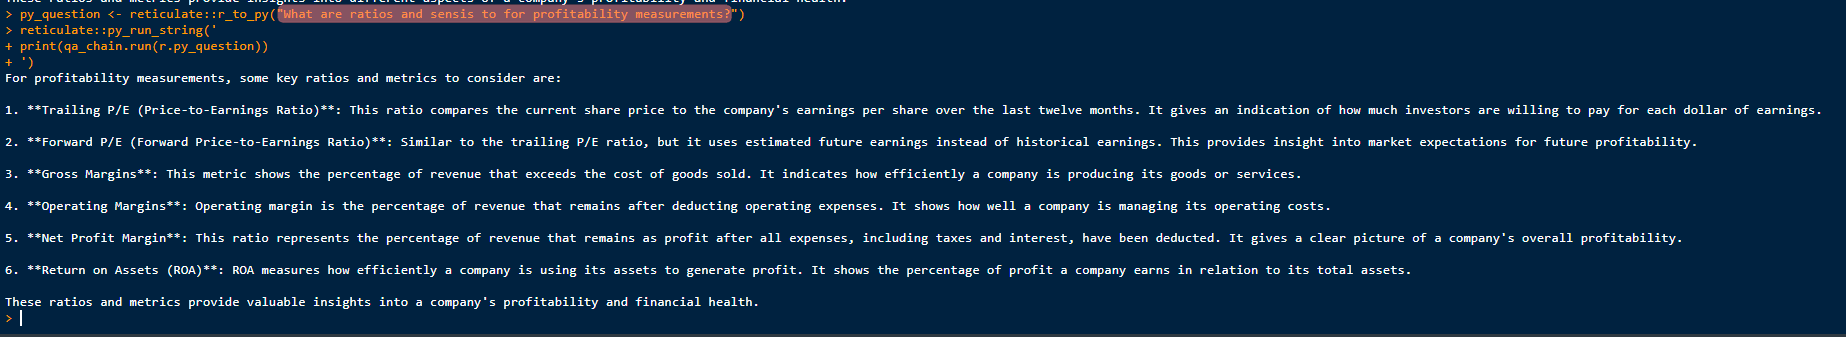
First of all, we can ask Chatgdp about the key figures and ratios that are of interest to us. If we want to focus on the financial health of the company, we ask “What are ratios and sensis for profitability measurements?”
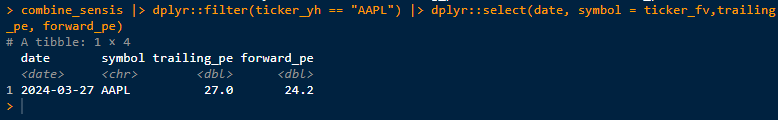
Furthermore, if we consider Apple’s P/E ratios in terms of a fair valuation assessment, we ask “What is the trailing_pe and forward_pe for AAPL at date 2024-03-27?”
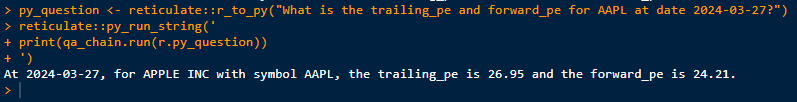
Double checking Apple’s database results:
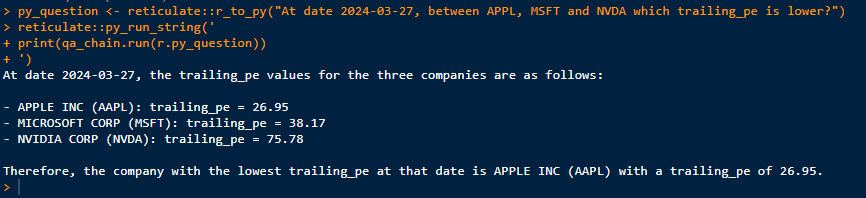
However, now that we know Apple’s PE ratio, we would like to know how it compares to Microsoft or Nvidia. Who has the lowest valuation as of the reporting date?
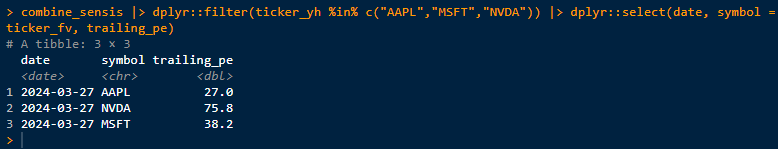
At the moment, being on the safe side, we are cross-checking the metrics against the key figures in our database:
From here on, the possibilities are many and the variations of questions are open to all sides. Nevertheless, as a small disclaimer: as with any innovation, the right approach is important here. The llm models have their known flaws and pitfalls (e.g. hallucinations) and with knowledge of these the right questions need to be asked as the performance of the models continues to improve:
As you will have surely noticed, we are passionate about leveraging new approaches to process data and make business workflows more efficient in a way that companies can benefit from and generate long-term value.
I’m happy to get in touch and discuss further ideas with you!