NEW APP for a price estimation using different available PE ratios in relation to estimated EPS.
This app allows to convert earnings expectations by analysts’ estimates for individual companies into current share price expectations. PE Ratio represents the ratio between the share price and the earnings achieved and is used to roughly determine the company valuation. The aim of the calculation is to determine whether the current share price of the company is “expensive” or “cheap” in relation to the expected profits and the investors’ willingness to pay a certain price premium for the company.
However, the analysis does not simply allow general statements to be made about whether a share is worth buying or not. Therefore, this price comparison can serve as a guide, but it cannot replace a comprehensive stock analysis.
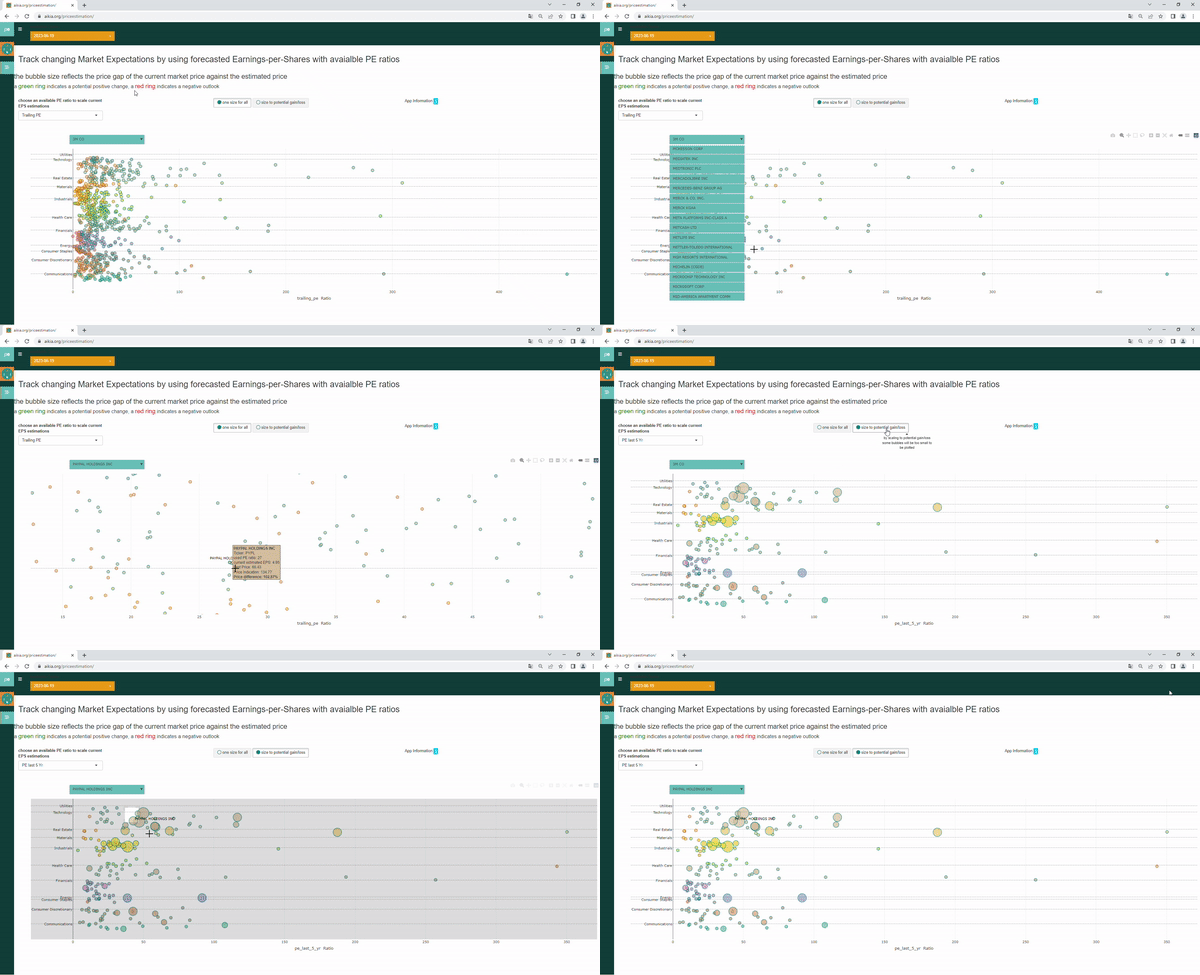
1 What is the anticipated Stock Value in the context of the Earnings Expectation?
At the analytical level, the statement of the expected price determination can be clearly determined. It works out the relationship between the current share price and the expected profit (current forecast by stock analysts). A lower expected value of the share price thus means that, in relation to historical or current price premiums (PE ratio), a comparatively lower profit meets a higher share price. The opposite is the case with an increased price expectation. The reasons for this are manifold.

2 App Structure via Peer Group comparison and Expected Profit/Loss scaling
Moreover, an expected price comparison makes greater sense when grouping companies that are comparable in terms of certain characteristics. In this way, overvalued stocks and/or entire sectors can be identified quickly and effectively.
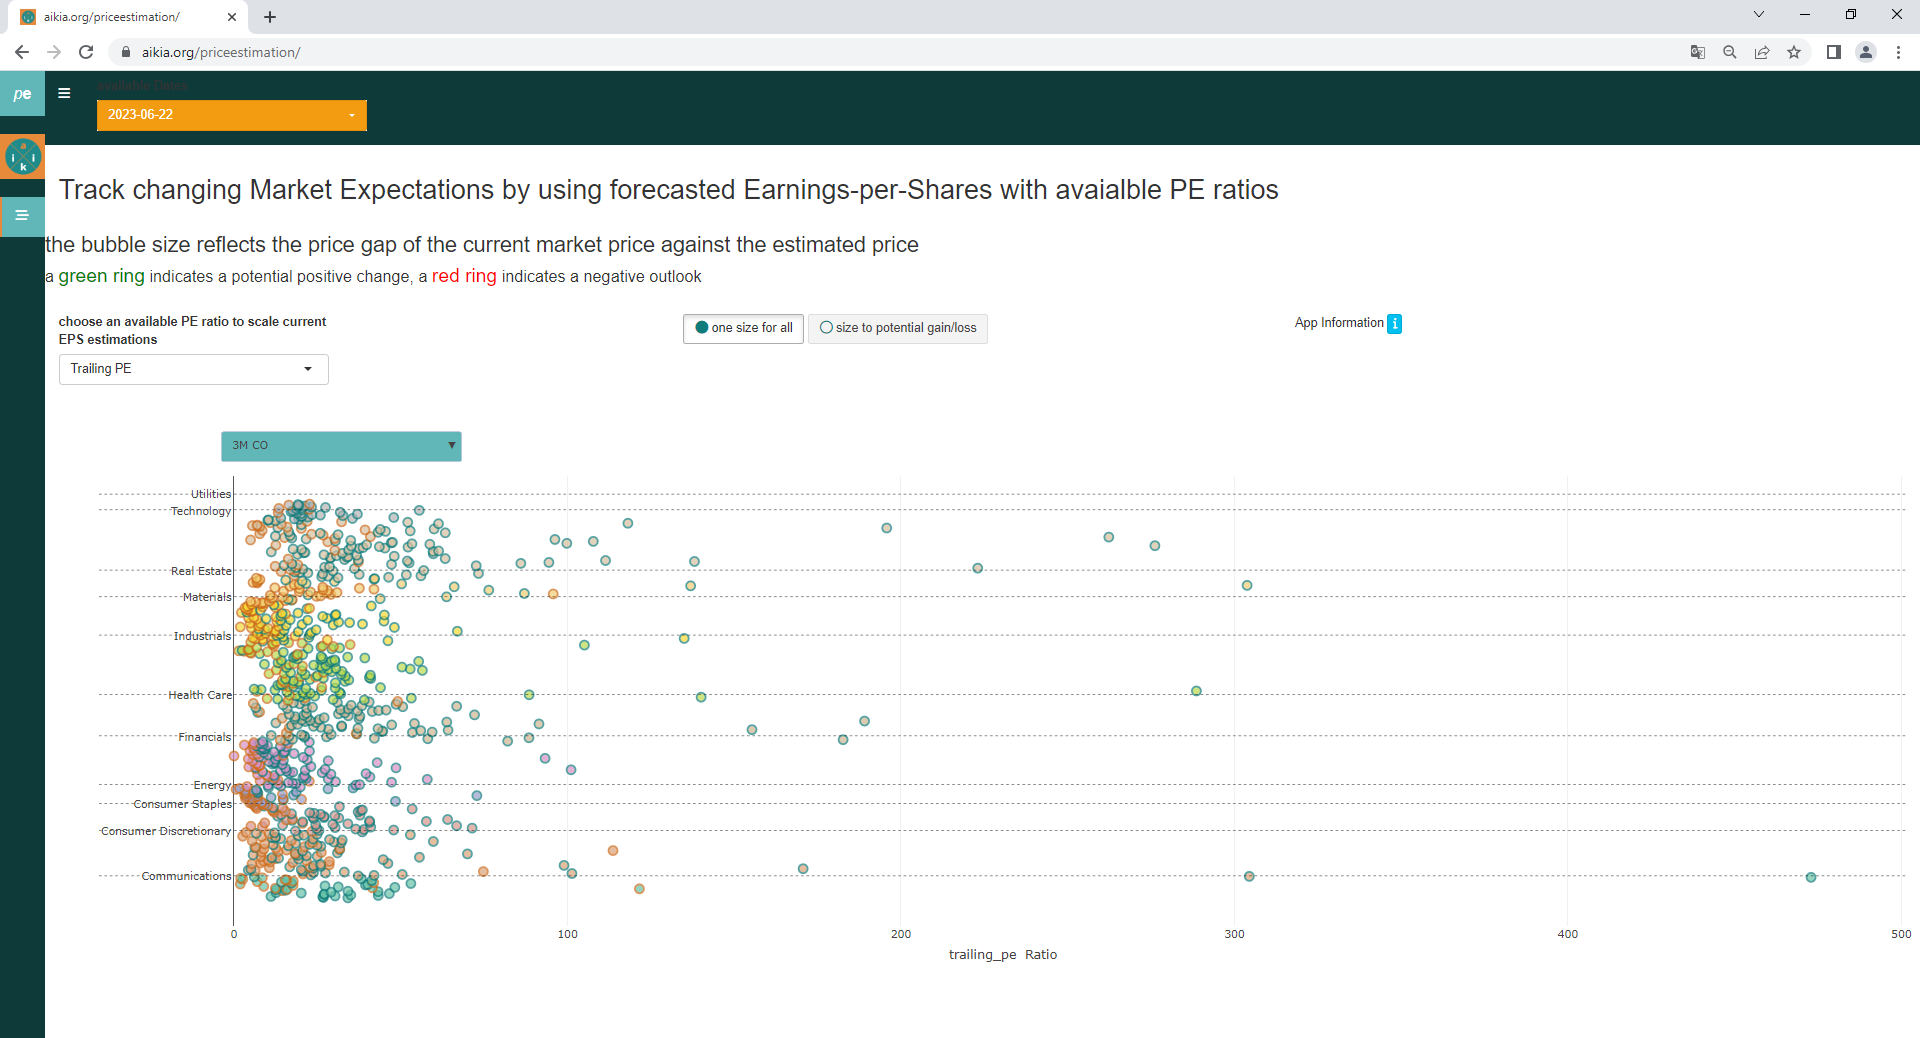
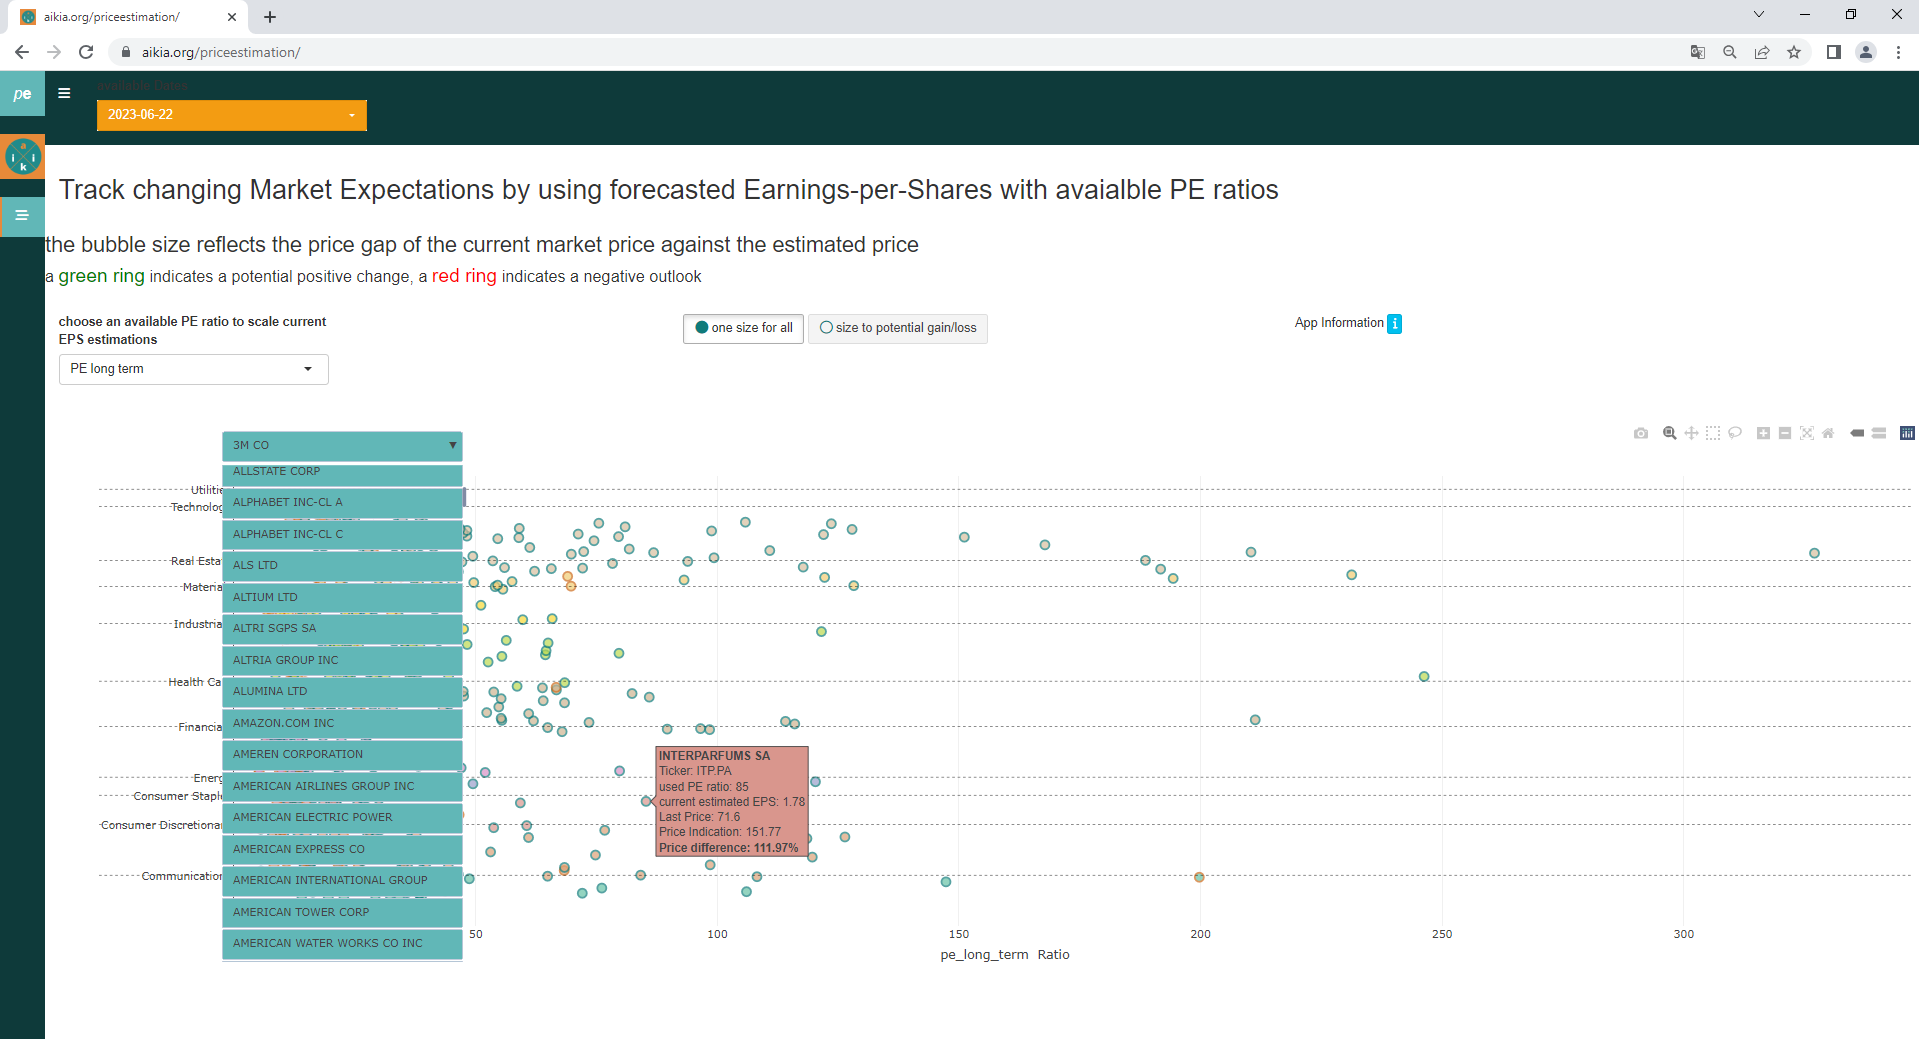
The app offers a graphical sorting of companies into Industry Group areas.
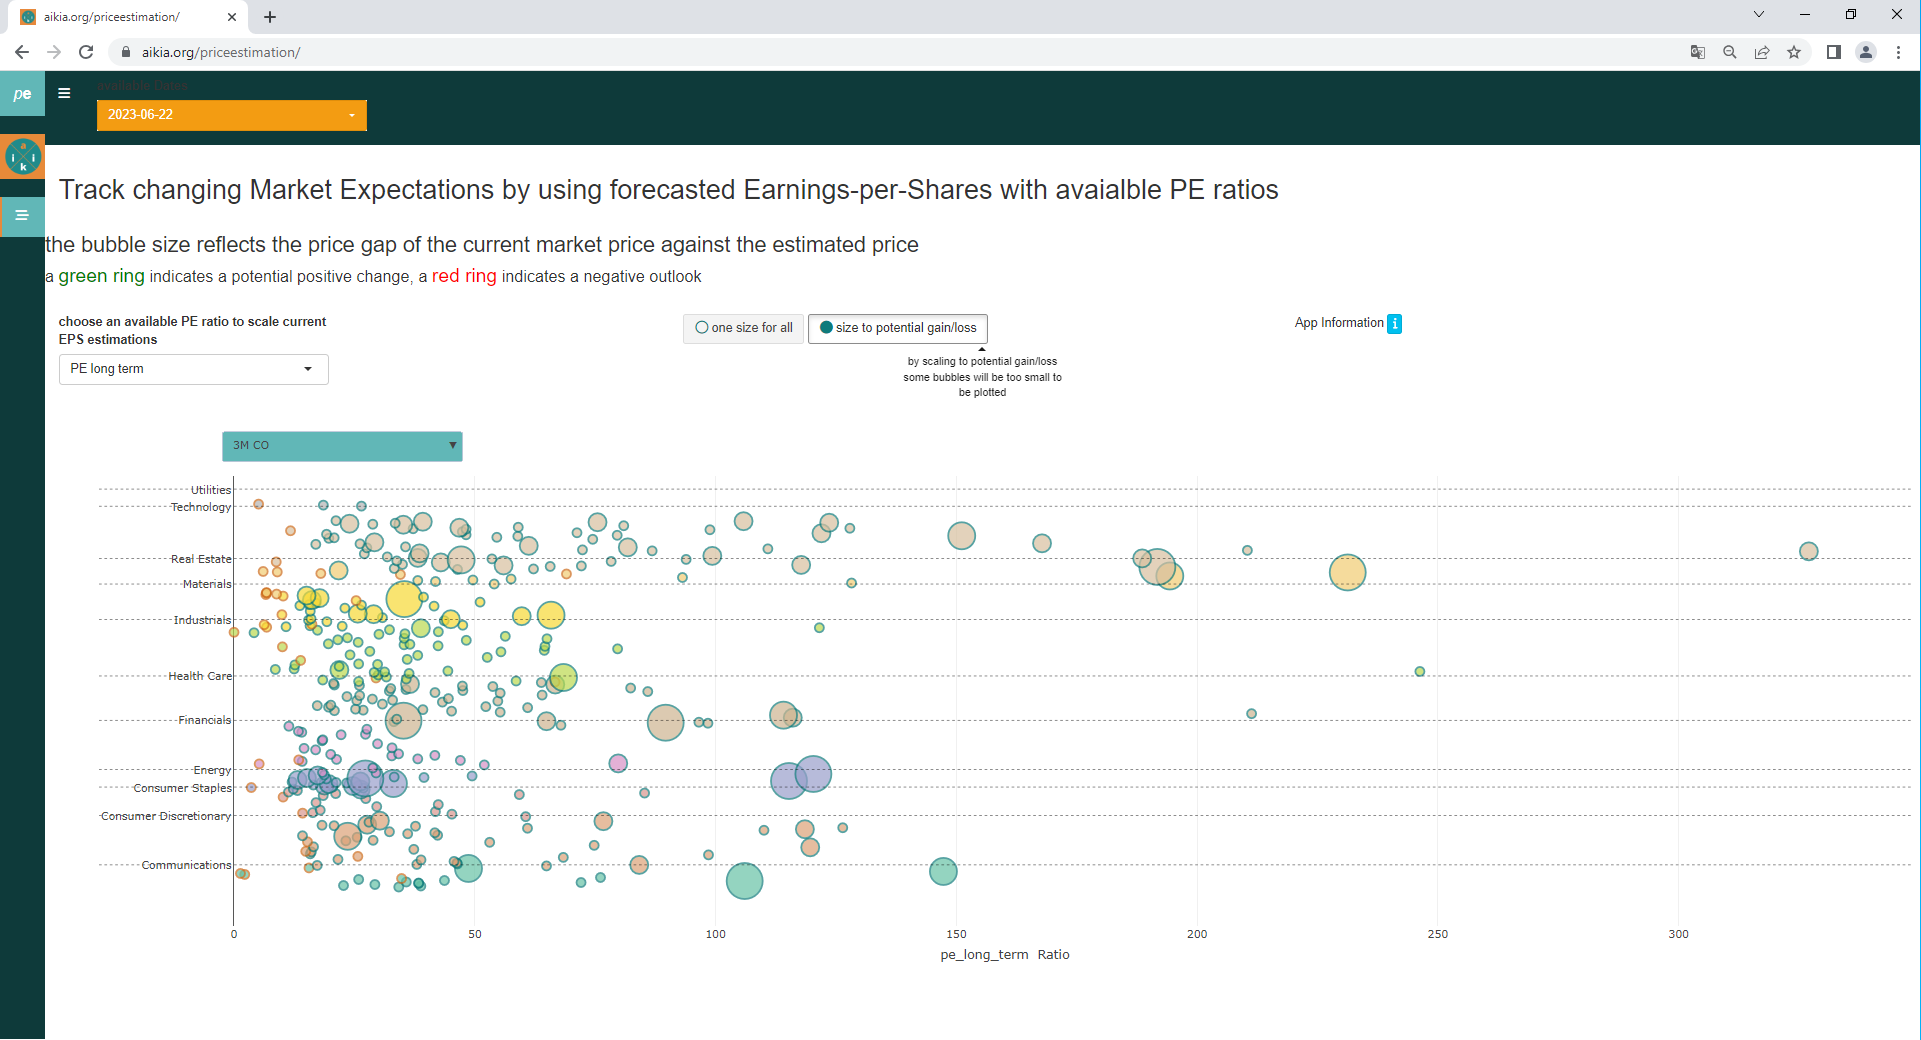
In addition, the size of potential gains/losses can be displayed graphically using the size scaling of the bubbles.
A potential gain is marked with a green circle border, a potential loss with a red circle border.
3 Idea of the App in the current Market Environment
We are getting into the new Q2 2023 reporting season, with one big difference from the last reporting season, as the sentiment and expectation going into the previous one was very negative. Estimates for earnings declines were over 7%, which didn’t materialize, and accordingly, the boomerang effect was strong. Better than expected results, better margins than expected, the economy is gaining momentum and also performing better than expected. All of this has paid off in share prices.
Now, the valuation is by no means cheap. With the S&P 500 index at over 4400 points, the valuation level and the starting point into the reporting season is different than at the beginning of the previous quarterly reporting season. The bar is higher now, and the risk of disappointment is indeed increasing. Especially since sentiment indicators are very bullish and shows that investors are becoming a bit more uncautious. If you look at the distance to the 50-day line in the leading indices and on single stock level almost 90% are trading above their 20-day line. The RSI (Relative Strength Index) also at a very strong overbought level, so some retracement would not necessarily be unusual.
There could be a few circumstances that could make it difficult for the short-term price trend:
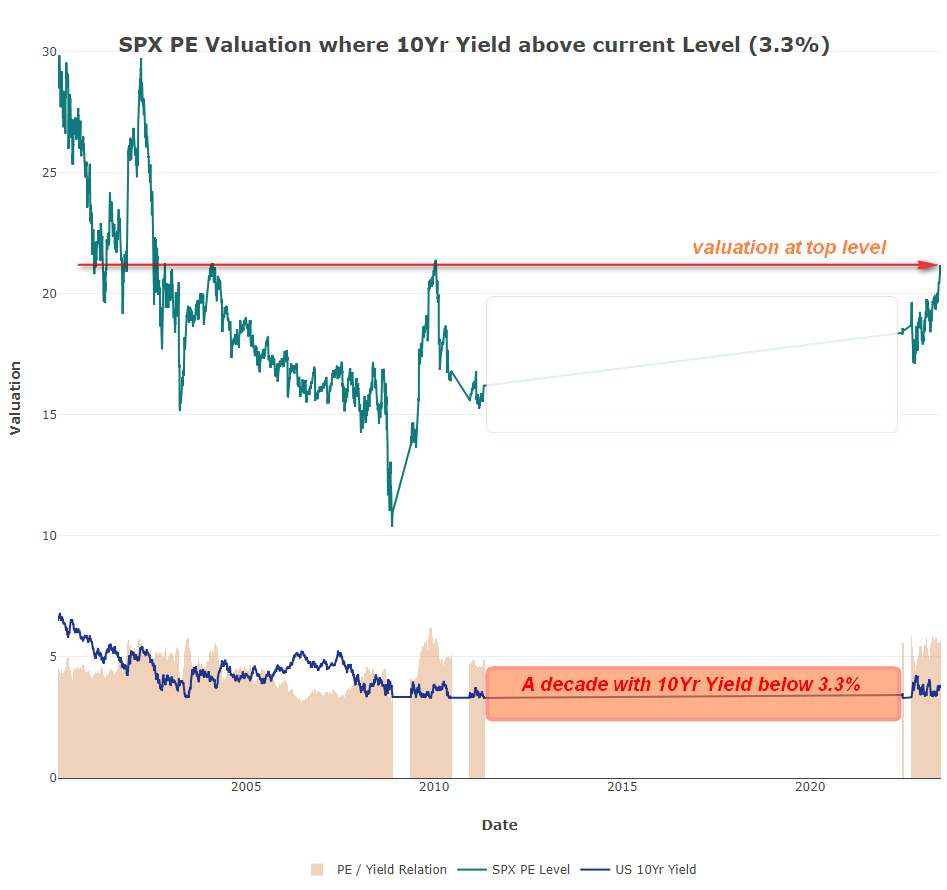
There seems to be a growing expectation that yields will not simply roll over and that valuations will come down to reasonable levels, as they are too high relative to yields historically.
In the case of global investment funds that hold equities and bonds, we have a rebalancing before the end of the month, which means that the two asset classes have to be brought back into line. If the equity market performed better than the bond side, then the equity weighting has to be reduced accordingly and brought back into line with the investment strategy of the respective fund. JPM estimates that by the end of the month, around 150 billion dollars of equities worldwide will be on the sell side.
The next factor, in the run-up to the reporting season, is the start of the so-called blackout period for American companies. This is a period in which share buybacks have to remain dormant. Share buybacks are, of course, also a strong, supportive factor for the American stock market.
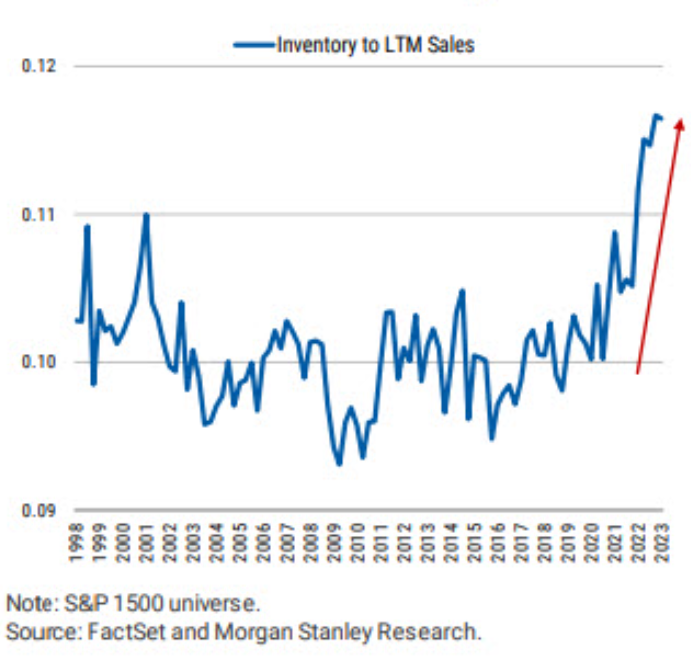
In addition, inventories have risen considerably in many areas. They are therefore at a historically very high level. If inventories have to be reduced for the time being, this will have a negative impact on companies’ margins in an environment of simplified supply chains, which means that we are entering a phase in which orders are more likely to be cancelled and in which the price war is increasing. The ability of companies to successfully implement price increases will decline considerably. This is also signaled in particular by producer prices and import and export prices.
To be tracked in the 'aikia Dashboard App'
4 Tracking of Estimations and Price Valuations
The interactive app makes it easy to track changes in market data that affect price trends in a particular company or even market segment. The trend that can be observed in this way can be used for an initial market assessment and the further tracking and analysis of individual values.
As always, we are open and appreciate suggestions, exchanges and recommendations either via LinkedIn or info@aikia.org!
DISCLAIMER
Unfortunately, people need to write one of these, even for blogs: All information and data on this website is for informational purposes only (what else would it be for?). I make no representations as to the accuracy, completeness, suitability, or validity of any information. I will not be liable for any errors, omissions, or any losses arising from its display or use. All information is provided AS IS with no warranties and confers no rights.
Because the information on this website is based on my personal opinion and experience, it should not be considered a specific purchase recommendation or professional financial investment advice. I am not liable for any losses incurred as a result of the implementation of the thoughts or ideas.